
Theme
Greenhouse gas emissions modelling.
Technologies
- time-series analysis (ARIMA)
- machine learning (multiple regression)
- statistics (correlation, mixed modelling)
Description
Analyse des émissions de gaz à effet de serre dans des conditions de concentrations atmosphériques en CO2 élevées. En résumé, cela mimique les conditions de changement climatique prévues pour l’année 2100.
Voir l’article “Présentation du site EucFACE” pour une description détaillée du projet, incluant l’hypothèse scientifique testée, matériel et méthodes et les références bibliographiques principales.

Vidéo 1: Moving up a ring at the EucFACE site.
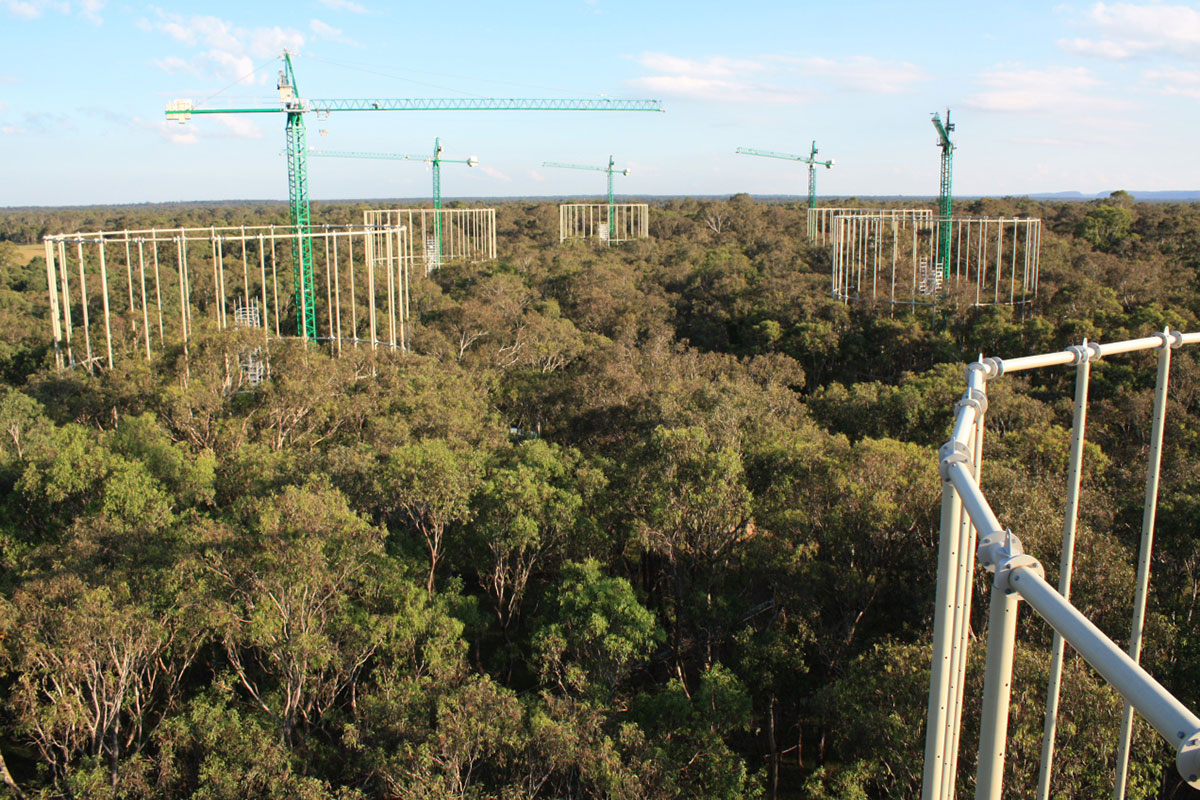
Photo 1: Canopy view from Ring 1 at the EucFACE Site.
Une analyse temporelle (time-series analysis) a été appliquée (Figure 1) pour tester l’hypothèse scientifique de départ:
« Quel est l’effet de l’augmentation du dioxide de carbone (CO2) dans l’atmosphère sur les émissions des gaz à effet de serre? »
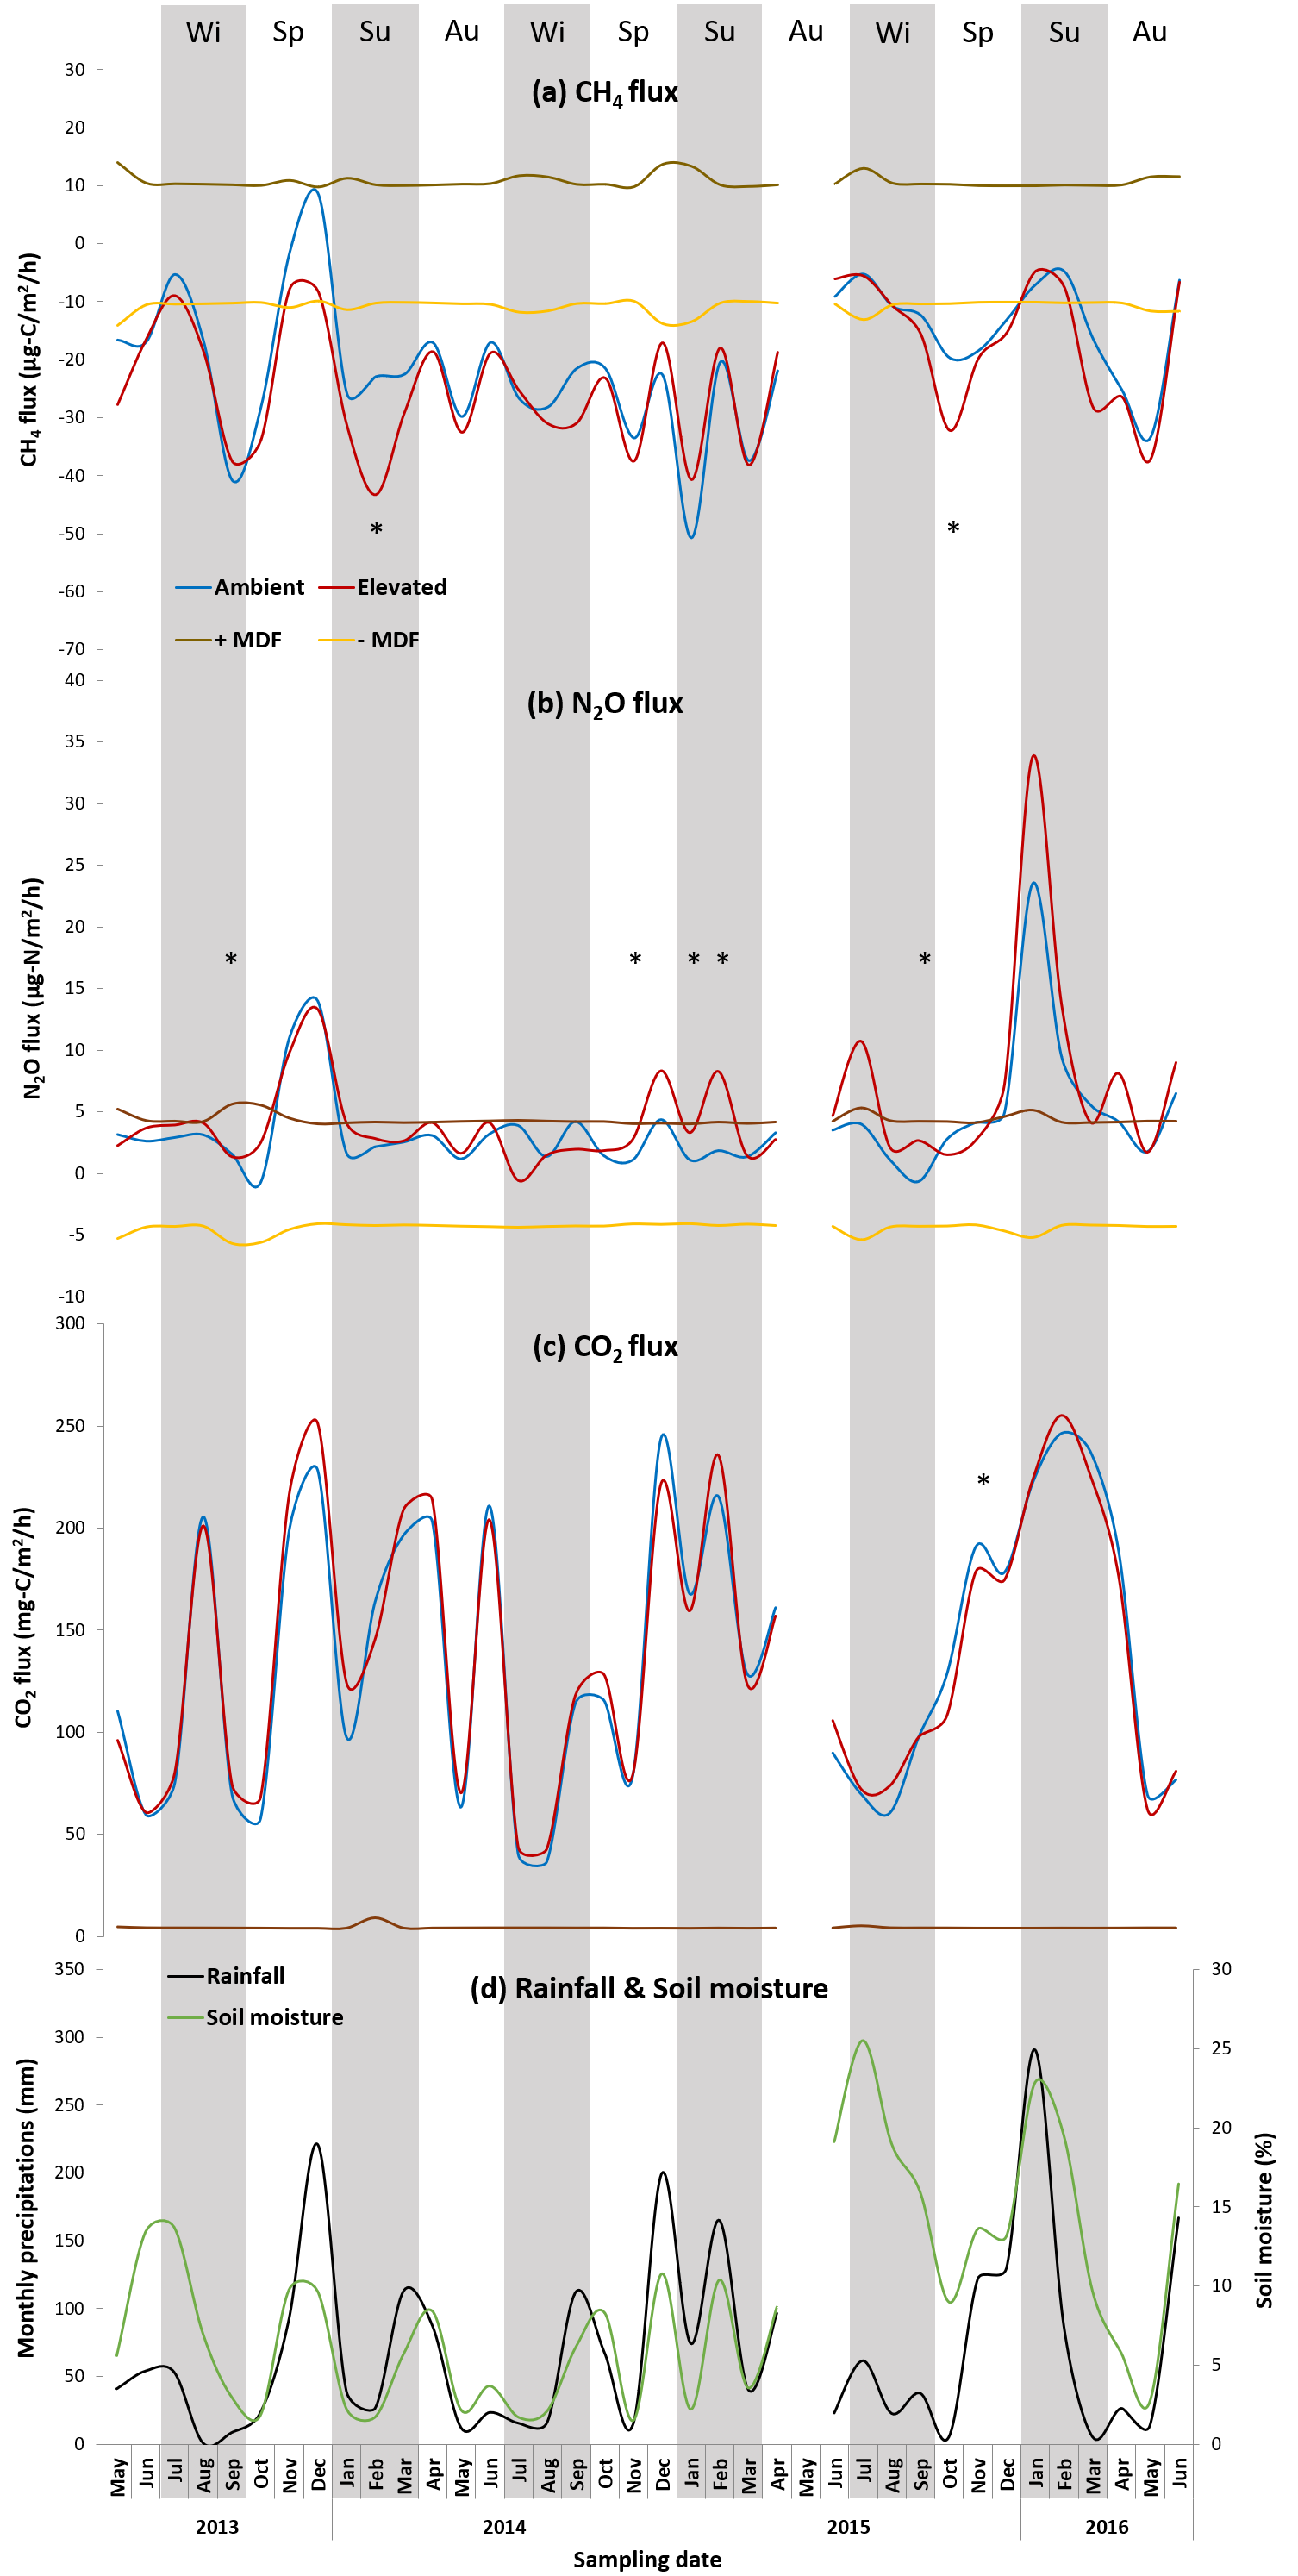
Figure 1: Greenhouse gas (GHG) emissions for méthane (CH4 flux - panel a), nitrous oxide (N2O flux - panel b) and carbon dioxide (CO2 flux - panel c). Ambient (blue line) and elevated (red line) atmosphérique CO2 concentrations represent the « treatment » applied to test the scientific hypothesis investigated.
There is a strong visible link between the intensity of GHG emissions and the intensity of the rainfall events (panel d).
Ces travaux ont été publiés par Martins, Nazaries et al., 2021 (In Production).
Rainfall frequency and soil water availability regulate soil methane and nitrous oxide emissions from a native forest exposed to elevated carbon dioxide. Functional Ecology.
[Credit for the header picture] Photo by veeterzy on Unsplash