
Analysis of greenhouse gas (GHG) emissions under elevated atmospheric CO2 concentrations.
Table of contents
Background
Greenhouse gas (GHG) emissions associated with human activities are well known to be the major contributors to climate change worldwide as reported by the Intergovernmental Panel on Climate Change (IPCC, 2013). These include:
- carbon dioxide (CO2)
- methane (CH4)
- nitrous oxide (N2O)
The Figure 1 shows the huge increase in GHG concentration in the atmosphere since the beginning of the so-called « industrial revolution » which started onwards the middle of the 19th century.

Figure 1: Atmospheric concentrations of important greenhouse gases over the last 2,000 years. Increases since about year 1750 are attributed to human activities in the industrial era. Concentration units are parts per million (ppm) or parts per billion (ppb). Source: Intergovernmental Panel on Climate Change (IPCC, 2007).
While the concentration of these gases continue to rise, forest ecosystems have been recently proposed as a natural solution to climate change (Griscom et al., 2017 [1]; Fargione et al., 2018 [2]) because of their significant capacity to sequestrate atmospheric carbon (C) within the soil profile and aboveground vegetation (Le Quéré et al., 2018 [3]).
Past research has also revealed that current atmospheric CO2 levels could increase by about 150 ppm before the year 2100 (Stocker et al., 2013 [4]). The increase of CO2 level in the atmosphere is largely expected to promote a greening effect (i.e. plant growth) in forests globally, however, given the concomitant expected global increase in droughts and aridity levels, such CO2 fertilisation effect is under debate due to increased water limitation feedback effects (Brodribb et al., 2020 [5]).
The EucFACE Experiment
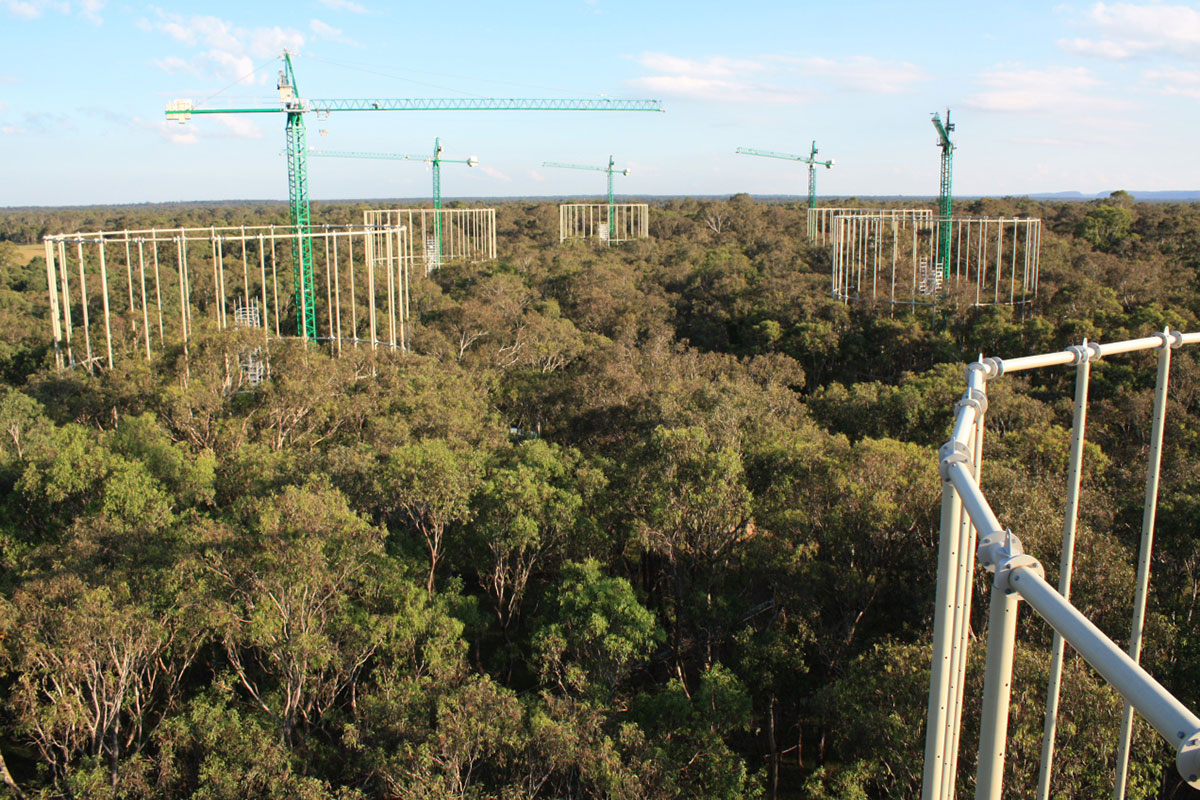
The Eucalyptus Free-Air CO2 Enrichment (EucFACE) experiment at Western Sydney University, near Richmond, New South Wales, Australia (33°37’S, 150°44’E, 23 m altitude) represents a unique facility for studying the effect of elevated atmospheric CO2 concentration on a remnant Cumberland Plain Woodland. A detailed description of the site, including vegetation and soil characteristics, can be found elsewhere (Crous et al., 2015 [6]; Drake et al., 2016 [7]; Gimeno et al., 2016 [8]).
The EucFACE is composed of six circular plots (henceforth called “rings”), 25 m in diameter and 28 m high. Mature old-growth (> 75-year-old) Eucalyptus tereticornis is the dominant species; however, the understorey vegetation varies significantly between rings (Hasegawa et al., 2018 [9]). Three rings are used as control and are fumigated with ambient air (aCO2) while the other three rings are fumigated with elevated CO2 concentrations (eCO2). Fumigation with CO2 is set to 150 ppm above that of the control rings (ambient + 150 ppm) in order to simulate the climate prediction for the year 2100 (Stocker et al., 2013 [4]). Fumigation started in September 2012 with +30 ppm CO2 and was ramped periodically for six months (+30 ppm every 4-5 weeks) until February 2013 (540 ppm).

Video 1: Moving up a ring at the EucFACE site.
Picture 1: Bird’s eye view of the 6 rings at EucFACE Site.
Aims & Hypotheses
Here, we conducted monthly measurements of (in situ) net CH4, N2O and CO2 fluxes from May 2013 to June 2016 to investigate the effects of elevated atmospheric CO2 (ambient vs. +150 ppm) concentrations on soil net CH4, N2O and CO2 fluxes from a mature Eucalypt woodland in New South Wales, Australia. The Eucalyptus Free-Air CO2 Enrichment (EucFACE) experiment is a unique research station established in 2012 in an Australian endangered woodland ecosystem (the Cumberland Plain).
The main aims of the present study were to:
Quantify the net CH4, N2O and CO2 fluxes under predicted elevated CO2 (eCO2) concentrations
Identify which climo-edaphic factors could best predict soil GHG emissions
We considered three different alternative hypotheses:
In mature forest, the feedback response of GHG fluxes to eCO2 will be minimal. The reason is that in old forests, trees are not expected to absorb large amount of CO2 (vs. plant growing phase), leading to reduced responses for ecosystem processes such as gas emissions
The response (sink or production) of each GHG investigated to eCO2 treatment will differ, with an expected increase of CO2 and N2O emissions while CH4 flux rates will be reduced
The magnitude of the GHG emissions will be strongly linked to climo-edaphic properties, such as rainfall events and soil water availability as it is responsible for regulating soil biological processes, particularly in water-limited environments.
Experimental Setup
Greenhouse gas measurements
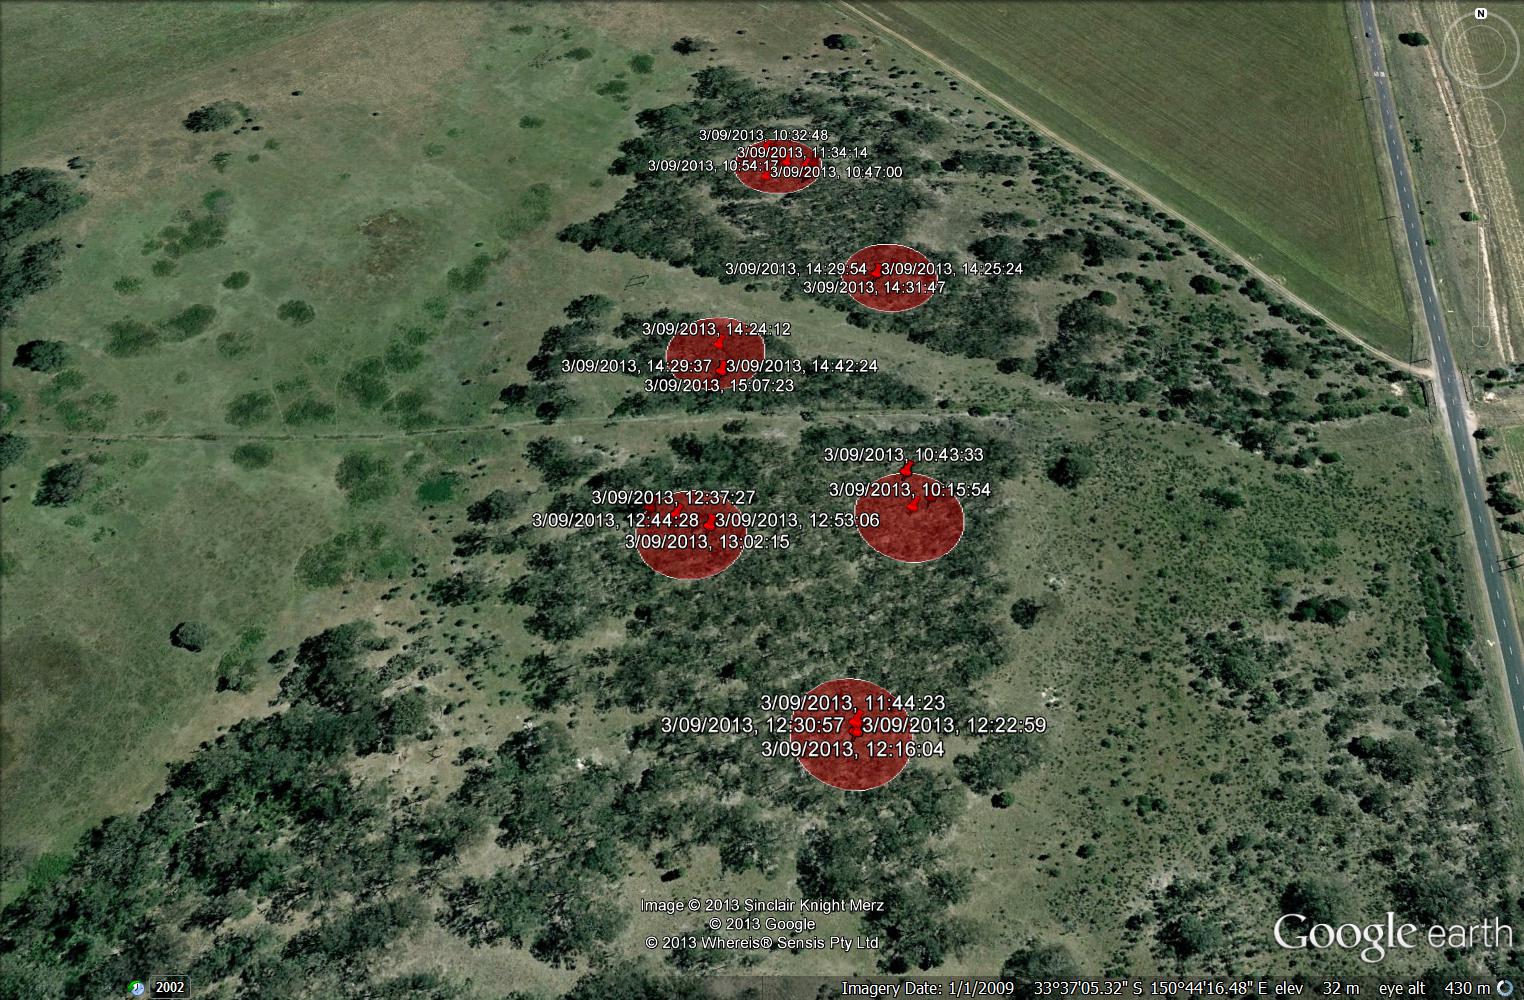
The collection of air samples for GHG analysis was conducted monthly, from seven collars permanently inserted into the ground, within each ring. The GHG sampling campaigns occurred over three years, between May 2013 to June 2016 (no sampling took place in May 2015), in a total of 37 monthly collections. More details related to the sampling strategy can be found in the supporting information section.
The measurement of the net GHG fluxes between soil and atmosphere was estimated using a “static chamber method”, or non-flow-through non-steady-state (Rochette & Eriksen-Hamel, 2008 [10]. Throughout the course of the experiment (chamber design, sample collection and analysis, data processing), guidelines from de Klein et al. (2012) [11] were followed. Briefly, a 25 ml air sample was collected from the chamber headspace (chamber characteristics: diameter ≈ 20 cm; height above ground ≈ 11 cm; headspace volume ≈ 5 L; soil insertion depth ≈ 7 cm) during a 45-minute deployment time and at four time points (tamb, t15, t30 and t45), see supporting information section for further details. The concentrations of CH4, N2O and CO2 were detected on a gas chromatography system against a seven-point serial dilution of a GHG standard mixture (5 ppm CH4, 600 ppm CO2 and 1 ppm N2O). Detailed gas chromatography system characteristics and chamber design are in supporting information.
The GHG concentrations were converted from ppm values to mass-based concentrations using a conversion factor derived from the ideal gas law (PV = nRT), where an air pressure P of 1 atm was assumed and an universal gas constant R of 0.082057 L atm K-1 h-1 mol-1 h-1. After including the chamber dimensions (headspace volume V, chamber’s base area A) and the corresponding molecular masses, the final flux units were μg-C(N) m-2 h-1 for CH4 and N2O, and mg-C m-2 h-1 for CO2. Greenhouse gas fluxes reported as negative represent net sinks (flux from atmosphere to soil).
Illustration of the headspace volume sampling method
| Air Sampling Chamber | Sampling Headspace Volume through a Sampling Port |
|---|---|
 |  |
References
[1]: Griscom, B.W., Adams, J., Ellis, P.W., Houghton, R.A., Lomax, G., Miteva, D.A., Schlesinger, W.H., Shoch, D., Siikamäki, J. V, Smith, P., Woodbury, P., Zganjar, C., Blackman, A., Campari, J., Conant, R.T., Delgado, C., Elias, P., Gopalakrishna, T., Hamsik, M.R., Herrero, M., Kiesecker, J., Landis, E., Laestadius, L., Leavitt, S.M., Minnemeyer, S., Polasky, S., Potapov, P., Putz, F.E., Sanderman, J., Silvius, M., Wollenberg, E., Fargione, J., 2017. Natural climate solutions. Proceedings of the National Academy of Sciences 114, 11645 LP – 11650. doi:10.1073/pnas.1710465114
[2]: Fargione, J.E., Bassett, S., Boucher, T., Bridgham, S.D., Conant, R.T., Cook-Patton, S.C., Ellis, P.W., Falcucci, A., Fourqurean, J.W., Gopalakrishna, T., Gu, H., Henderson, B., Hurteau, M.D., Kroeger, K.D., Kroeger, T., Lark, T.J., Leavitt, S.M., Lomax, G., McDonald, R.I., Megonigal, J.P., Miteva, D.A., Richardson, C.J., Sanderman, J., Shoch, D., Spawn, S.A., Veldman, J.W., Williams, C.A., Woodbury, P.B., Zganjar, C., Baranski, M., Elias, P., Houghton, R.A., Landis, E., McGlynn, E., Schlesinger, W.H., Siikamaki, J. V, Sutton-Grier, A.E., Griscom, B.W., 2018. Natural climate solutions for the United States. Science Advances 4, eaat1869. doi:10.1126/sciadv.aat1869
[3]: Le Quéré, C., Moriarty, R., Andrew, R.M., Peters, G.P., Ciais, P., Friedlingstein, P., Jones, S.D., Sitch, S., Tans, P., Arneth, A., 2015. Global carbon budget 2014. Earth System Science Data 7, 47–85
[4]: Stocker, T., Qin, D., Plattner, G., Tignor, M., Allen, S., Boschung, J., Nauels, A., Xia, Y., Bex, B., Midgley, B., 2013. IPCC 2013: Climate Change 2013, The Physical Science Basis. Contribution of Working Group I to the Fifth Assessment Report to the Intergovernmental Panel on Climate Change. Cambridge University Press, Cambridge, United Kingdom and New York, NY, USA
[5]: Brodribb, T.J., Powers, J., Cochard, H., Choat, B., 2020. Hanging by a thread? Forests and drought. Science 368, 261–266
[6]: Crous, K.Y., Ósvaldsson, A., Ellsworth, D.S., 2015. Is phosphorus limiting in a mature Eucalyptus woodland? Phosphorus fertilisation stimulates stem growth. Plant and Soil 391, 293–305. doi:10.1007/s11104-015-2426-4
[7]: Drake, J.E., Macdonald, C.A., Tjoelker, M.G., Crous, K.Y., Gimeno, T.E., Singh, B.K., Reich, P.B., Anderson, I.C., Ellsworth, D.S., 2016. Short-term carbon cycling responses of a mature eucalypt woodland to gradual stepwise enrichment of atmospheric CO2 concentration. Global Change Biology 22, 380–390. doi:10.1111/gcb.13109
[8]: Gimeno, T.E., Crous, K.Y., Cooke, J., O’Grady, A.P., Ósvaldsson, A., Medlyn, B.E., Ellsworth, D.S., 2016. Conserved stomatal behaviour under elevated CO2 and varying water availability in a mature woodland. Functional Ecology 30, 700–709. doi:10.1111/1365-2435.12532
[9]: Hasegawa, S., Piñeiro, J., Ochoa‐Hueso, R., Haigh, A.M., Rymer, P.D., Barnett, K.L., Power, S.A., 2018. Elevated CO2 concentrations reduce C4 cover and decrease diversity of understorey plant community in a Eucalyptus woodland. Journal of Ecology 106, 1483–1494
[10]: Rochette, P., Eriksen-Hamel, N.S., 2008. Chamber Measurements of Soil Nitrous Oxide Flux: Are Absolute Values Reliable? Soil Science Society of America Journal 72, 331–342. doi:10.2136/sssaj2007.0215
[11]: De Klein, C.A.M., Harvey, M., 2012. Nitrous oxide chamber methodology guidelines. Global Research Alliance on Agricultural Greenhouse Gases, Ministry for Primary Industries: Wellington, New Zealand